Back to chapter figures
Figure 6.20
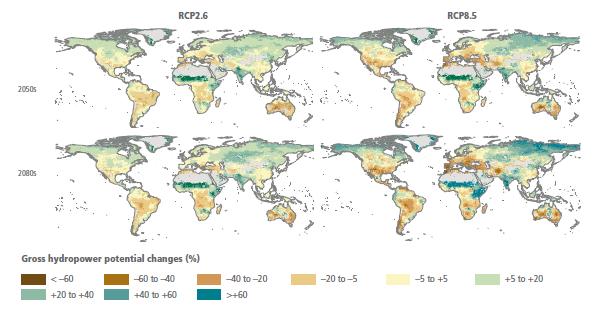
Figure caption
Figure 6.20 | Global spatial patterns of changes in gross hydropower potential based on climate forcing from five climate models. Changes are shown for the 2050s (upper) and the 2080s (lower) for the low-emission scenario (RCP2.6; left) and highest emission scenario (RCP8.5; right) scenarios relative to the control period (1971–2000). Source: data from van Vliet et al. (2016b).